Introduction
Understanding the biomarkers of aging is key to apprehending the aging process and developing effective strategies for promoting healthspan and longevity. These biomarkers provide measurable indicators of biological age, allowing researchers and clinicians to assess how well the body functions beyond chronological years.
Assessing the aging process from multiple angles offers a comprehensive view, from molecular markers like telomere length and DNA methylation clocks to phenotypic indicators such as grip strength and walking speed. This article examines relevant aging biomarkers, including molecular, phenotypic, diagnostic, and epigenetic markers, in understanding, predicting, and potentially modifying the course of aging.
Biomarkers of aging can be based on phenotypic data (physical function and anthropometry) and molecular data (e.g., telomere length, epigenetic clocks & laboratory blood biomarkers). Routine laboratory biomarkers are commonly measured in accredited clinical laboratories based on standardized methods. A combination of comprehensive laboratory, epigenetic, non-epigenetic and physical capability and organ function biomarkers, and senescence markers, are most likely the key to formulating a valid composite biomarker of aging.
However, a standardized (composite) biomarker of aging that specifically measures all important aspects of aging is yet to be established and fully validated.

Molecular Biomarkers of Aging
Molecular biomarkers of aging are based on high-throughput analyses, which are often of unknown predictive value and are primarily used in a research context only. These are mostly so-called all genome-level (“omics”) biomarkers.
|
Biomarker category |
Biomarker subcategory |
Biomarker |
Trend with age |
|
DNA and chromosome |
Telomere |
Leukocyte telomere length |
Decrease |
| DNA and chromosome |
DNA repair |
γ-H2A.X immunohistochemistry |
Increase |
| DNA and chromosome |
Epigenetic modification |
DNA methylation |
Global hypomethylation and local hypermethylation |
|
RNA transcriptome |
Transcriptome profiles |
Heterogeneity of CD38 in CD4+ & CD27+ T cells |
Decrease |
| RNA transcriptome |
Heterogeneity of CD197 in CD4+ & CD25+ T cells |
Increase |
|
| RNA transcriptome |
Circulating microRNAs (miRNAs) |
miR-34a, miR-21, miR-126-3p |
Increase |
| RNA transcriptome |
miR-151a-3p, miR-181a-5p, miR-1248 |
Decrease |
|
| RNA transcriptome |
Long non-coding RNAs |
MIR31HG |
Increase in cell senescence |
| RNA transcriptome |
AK156230 |
Decrease in cell senescence |
|
| RNA transcriptome |
Meg3 |
Increase in cell senescence |
|
|
Metabolism |
Nutrient sensing |
Growth hormone and insulin/insulin-like growth factor 1 (IGF-1) |
Decrease |
| Metabolism |
Mechanistic target of rapamycin (mTOR) and pS6RP |
Increase |
|
| Metabolism |
NAD+, SIRT1, SIRT2, SIRT3, SIRT6 |
Decrease |
|
| Metabolism |
Protein metabolism |
Protein carbamylation, such as homocitrulline rate |
Increase |
| Metabolism |
Advanced glycation end-products and N-glycans |
Increase |
|
| Metabolism |
Lipid metabolism |
Triglycerides |
Increase |
|
Oxidative stress and mitochondria |
o-tyrosine, 3-chlorotyrosine, 3-nitrotyrosine, 8-iso prostaglandin F2α, 8-hydroxy-2′-deoxyguanosine, 8-hydroxyguanosine |
Increase |
|
|
Cell senescence |
Senescence-associated β-galactosidase |
Increase in cell senescence |
|
| Cell senescence |
p16INK4A |
Increase in cell senescence |
|
|
Inflammation and intercellular communication |
Senescence-associated secretory phenotype |
Increase |
Table: Molecular biomarkers of aging.
Source: Xia, X. & Chen, W. & McDermott, J. & Han, J. (2017). Molecular and phenotypic biomarkers of aging. F1000Research 6: 860.
GlycanAge Blood Test
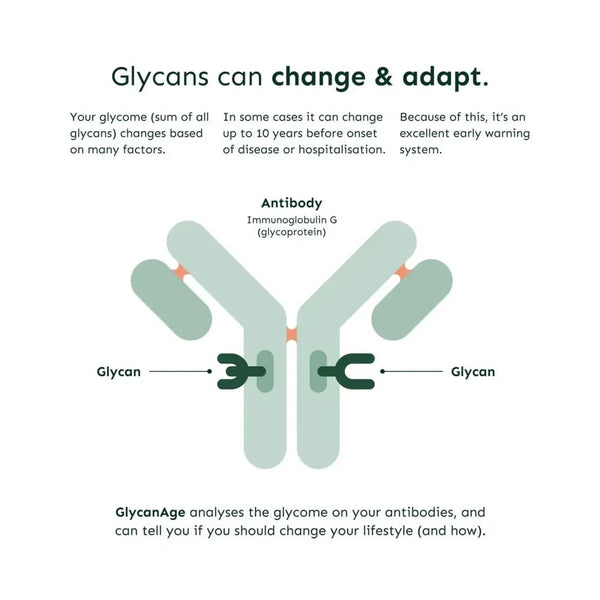
GlycanAge is an at-home blood test that analyses glycans (sugars that coat cells) in the body to determine your biological age. They look at your IgG glycome composition (which regulates low-grade chronic inflammation and drives aging). GlycanAge technology goes beyond existing biological age tests by integrating genetic, epigenetic and environmental aspects of aging.(1)
LEARN MORE ABOUT GLYCANAGE TEST HERE
Phenotypic Biomarkers of Aging
Non-molecular phenotypic biomarkers describe the physiological functions of the body, specifically physical capability and organ function. Aging leads to changes at the structural, functional, and molecular levels of most cells, tissues and organ systems. Progressive and gradual loss of the maintenance functions of tissues is peculiar in aging.(2)
|
Biomarker category |
Biomarker |
Trend with age |
|
Physical function |
Walking speed |
Decrease |
|
Chair stand |
Decrease |
|
|
Standing balance |
Decrease |
|
|
Grip strength |
Decrease |
|
|
Anthropometry |
Muscle mass |
Decrease |
|
Body mass index |
Increase |
|
|
Waist circumference |
Increase |
|
|
Facial features |
Mouth width |
Increase |
|
Nose width |
Increase |
|
|
Mouth-nose distance |
Increase |
|
|
Eye corner slope |
Decrease |
Table: Phenotypic biomarkers of aging.
Source: Xia, X. & Chen, W. & McDermott, J. & Han, J. (2017). Molecular and phenotypic biomarkers of aging. F1000Research 6: 860.
Diagnostic Biomarkers of Aging
Diagnostic biomarkers help to diagnose, confirm, or exclude a disease. They can be prognostic for death (mortality) or for the onset and progression of disease (morbidity). Diagnostic biomarkers can also be predictive for monitoring success or failure of some treatment. These biomarkers are also used in preventive healthcare to predict and more importantly prevent an onset of a disease.
|
Potential biomarker |
Age linked process |
Result possibly linked to aging |
|
Lymphocytes/WBC (in complete blood count) [PA] |
Inflammation and autoimmune disorders |
Chronically lowered or elevated |
|
Insulin |
Insulin resistance & diabetic state |
Chronically elevated |
|
Glucose & fasting glucose |
Insulin resistance & diabetic state |
Chronically elevated |
|
C-reactive protein (CRP/hs-CRP) [IA & PA] |
Inflammation, cancer & cardiovascular disease |
Chronically elevated |
|
Cholesterol |
Cardiovascular disease |
Chronically lowered or elevated |
|
Albumin [PA] |
Kidney and liver dysfunction |
Lowered |
|
IL-6 [PA] |
Inflammation |
Elevated |
|
Tumor necrosis factor alpha (TNF-α) |
Inflammation and cancer |
Elevated |
|
Hemoglobin |
Anemia and other hematopoietic disorders |
Chronically lowered or elevated |
|
Insulin-like growth factor 1 (IGF-1) |
Metabolic disease |
Elevated |
|
LDL-cholesterol |
Cardiovascular disease |
Chronically lowered or elevated |
|
Triglycerides |
Cardiovascular disease |
Chronically elevated |
|
HDL-cholesterol |
Cardiovascular disease |
Chronically lowered |
|
Creatinine [PA] |
Kidney dysfunction |
Elevated |
|
Monocytes |
Inflammation |
Chronically elevated |
|
Glycated hemoglobin (HbA1C) |
Insulin resistance & diabetic state |
Elevated |
|
Cystatin C |
Kidney dysfunction |
Elevated |
|
NT-proBNP |
Heart failure |
Elevated |
|
Alkaline phosohatase [PA] |
Liver damage & bone disorder |
Chronically elevated |
|
Hematocrit/RBC (in complete blood count) |
Anemia |
Chronically lowered or elevated |
|
D-dimer |
Hypercoagulable state |
Elevated |
|
IL-8 [IA] |
Inflammation |
Elevated |
|
Plasminogen activator inhibitor-1 (PAI1) |
Prothrombotic state in cancer and other acute phases |
Chronically elevated |
|
Bilirubin |
Liver dysfunction |
Chronically elevated |
|
Urea |
Renal dysfunction |
Chronically elevated |
|
IL-15 |
Inflammation |
Chronically elevated |
|
MCV (in complete blood count) |
Anemia and other hematopoietic disorders |
Chronically lowered or elevated |
|
MCHC (in complete blood count) |
Anemia and other hematopoietic disorders |
Chronically lowered or elevated |
|
CD4/CD8 ratio |
Immune deficiency and autoimmunity |
Chronically lowered |
|
C-peptide (preferable to insulin) |
Insulin resistance & diabetic state |
Chronically elevated |
|
IL1-β |
Inflammation |
Chronically elevated |
Table: Potential routine laboratory blood markers.
Source adapted from: Hartmann, A. et al. (2021). Ranking biomarkers of aging by citation profiling and effort scoring. Frontiers in Genetics 12: 797.
Epigenetic laboratory biomarkers
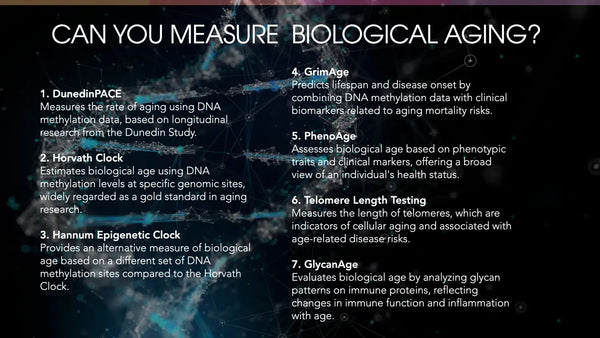
The epigenome is a dynamic system that plays a major role in aging. DNA methylation and histone modifications change with chronological age and with chronic diseases over time.(3) Aging is associated with general hypomethylation and local hypermethylation. To appropriately analyze DNA methylation, various “epigenetic clocks” have been developed (such as the Horvath clock, Weidner Clock and Hannum clock).(4)
|
Potential biomarker |
Material & method |
Prediction |
|
DNA methylation and aging clocks: |
||
|
Horvath’s clock |
DNA (methylation analysis) |
Chronological age |
|
Hannum’s clock |
DNA (methylation analysis) |
Chronological age |
|
DNAm GrimAge |
DNA (methylation analysis) |
Biological age |
|
DNAm PhenoAge |
DNA (methylation analysis) |
Biological age |
|
Weidner clock |
DNA (methylation analysis) |
Chronological age |
|
EpiTOC |
DNA (methylation analysis) |
Biological age |
|
miRNA (microRNA) |
RNA (next gen sequencing microarrays) |
Morbidity, mortality |
|
Non-coding RNA expression profiles |
RNA (sequencing) |
Chronological age |
|
exRNA (extracellular RNA) |
Blood/plasma (next gen sequencing) |
Morbidity, mortality |
|
Histone modifications: |
||
|
H4K20 methylation |
Blood/plasma (multiple methods) |
Cell stress |
|
H4K16 acetylation |
Blood/plasma (multiple methods) |
Cell stress |
|
H3K4 methylation |
Protein extract (multiple methods) |
Cell stress |
|
H3K9 methylation |
Tissue DNA (multiple methods) |
Cell stress |
|
H3K27 methylation |
Tissue DNA (multiple methods) |
Cell stress |
|
Chromatin remodeling |
DNA (chromatin remodeling assays) |
Chronological age |
Table: Potential epigenetic biomarkers.
Source adapted from: Hartmann, A. et al. (2021). Ranking biomarkers of aging by citation profiling and effort scoring. Frontiers in Genetics 12: 797.
To summarize: Aging is an extremely complex and highly individual process that is not fully understood. Therefore many biomarkers related to aging may only scratch the surface and give a point of view from a specific angle on what comes to aging. Hence, a combination of wide-ranging routine laboratory tests, epigenetic tests, molecular biomarkers, and phenotypic markers may be the best solution to evaluate a comprehensive view of an individual aging process.

DNAm PhenoAge - An easy-to-do biomarker test of biological aging
A study by Levine et al. 2018 introduced a novel approach to developing an epigenetic biomarker of aging using DNA methylation (DNAm). This new biomarker, DNAm PhenoAge, represents a significant advancement over previous markers by focusing on phenotypic age rather than chronological age, resulting in improved predictions of healthspan and mortality risks. DNAm PhenoAge demonstrates a remarkable ability to predict a wide range of morbidity and mortality outcomes, particularly cardiovascular and coronary heart disease. Unlike earlier biomarkers, DNAm PhenoAge extends its predictive power beyond blood samples to other tissues.(4)
The biomarker's moderately heritable nature is linked to markers of immunosenescence, pro-inflammatory processes and various factors associated with aging. DNAm PhenoAge outperforms earlier epigenetic biomarkers due to its specific selection of CpG sites optimized for predicting physiological dysregulation. While it is not intended to replace clinical biomarkers in medical decisions, DNAm PhenoAge offers valuable insights into aging mechanisms and the assessment of aging interventions.
Furthermore, the biomarker's potential to differentiate pre-clinical aging and cell/tissue-specific aging rates makes it a valuable tool for various age-related studies. The study delves into the associations between DNAm PhenoAge and transcriptional pathways, revealing connections with pro-inflammatory, interferon and damage repair pathways. The heritability of DNAm PhenoAge is possible, which requires further research to uncover its genetic architecture.
Interestingly, DNAm PhenoAge remains relatively stable over time, prompting questions about the influence of genetics and the persistence of social and behavioral characteristics. The biomarker's potential applications include assessing aging interventions and gaining insights into the dynamics of the aging process. DNAm PhenoAge emerges as a promising biomarker with implications for fundamental research into aging mechanisms and practical translational applications.
The list of biomarkers included in DNAm PhenoAge test:
- Albumin (g/L) – liver
- Creatinine (μmol/L) – kidney
- Glucose, serum (mmol/L) – metabolic
- C-reactive protein (mg/dL) – inflammation
- Mean cell volume (fL) – immune
- Red cell distribution width (%) – immune
- Alkaline phosphatase (U/L) – liver
- White blood cell count (1000 cells/μL) - immune
Calculate your DNAm PhenoAge here (if you have all the biomarkers tested mentioned above).
Conclusion
Aging is a multifaceted and highly individualized process influenced by molecular, cellular and physiological changes. Biomarkers of aging, ranging from telomere length and DNA methylation patterns to physical performance and organ function metrics, provide a valuable framework for studying and managing this complexity. Despite significant advancements, no single standardized biomarker fully captures all dimensions of aging, which highlights the need for integrative approaches combining multiple biomarker types. Tools such as DNAm PhenoAge represent a promising step forward, offering insights into the biological mechanisms of aging and potential interventions. With further development, scientific research, and experience, these biomarkers will continue to serve as critical instruments for advancing precision medicine, promoting healthy aging and optimizing longevity strategies.
Scientific References:
- Dall’Olio, F., & Malagolini, N. (2021). Immunoglobulin G Glycosylation Changes in Aging and Other Inflammatory Conditions. Antibody Glycosylation, 303-340.
- López-Otín, C. & Blasco, M. & Partridge, L. & Serrano, M. & Kroemer, G. (2013). The hallmarks of aging. Cell 153 (6): 1194–1217.
- Ashapkin, V. & Kutueva, L. & Vanyushin, B. (2019). Epigenetic clock: just a convenient marker or an active driver of aging? Reviews on Biomarker Studies in Aging and Anti-Aging Research 175–206.
Additional references for tables and biomarkers:
- Xia, X. & Chen, W. & McDermott, J. & Han, J. (2017). Molecular and phenotypic biomarkers of aging. F1000Research 6: 860.
- Hartmann, A. et al. (2021). Ranking biomarkers of aging by citation profiling and effort scoring. Frontiers in Genetics 12: 797.


